大家好,欢迎来到IT知识分享网。
本期主要讲解一下从R2019a到R2022a版本MATLAB在绘图方面有了哪些实用的功能?
R2019a
19a.1 十六进制颜色可用
之前的版本中MATLAB的图形对象只能使用0-1范围内的RGB用于给图形对象赋予颜色,但自19a开始可以使用十六进制码对颜色进行赋值,例如:
t=linspace(0,4*pi,500); y1=cos(t).^2; y2=sin(t).^2./t; hold on area(t,y1,'FaceColor','#A94047','FaceAlpha',.6); area(t,y2,'FaceColor','#004073','FaceAlpha',.6) 19a.2 图形导出空白更少
如同所示,若将XTick\YTick设置为[],将XColor\YColor设置为none则导出区域更小,只有图示矩形区域。
19a.3 可交互平行坐标图
更新了一个新的绘图函数parallelplot,用于绘制可交互的平行坐标图(parallel coordinates plot):
outages=readtable('outages.csv'); coordvars=[1 3 4 6]; p=parallelplot(outages,'CoordinateVariables',coordvars,'GroupVariable','Cause'); 19a.4 实时编辑器控件
我在不得不知道的小技巧第二期提到过这玩意,在这再重述一遍叭:
这是一个更方便调整参数的模块。点击图示按钮即可插入各种类型的控件:
插入之后双击控件即可设置其属性:
举几个简单的例子(因为推送显示不了控件,因此给出的代码为无控件版本,请自行添加控件):
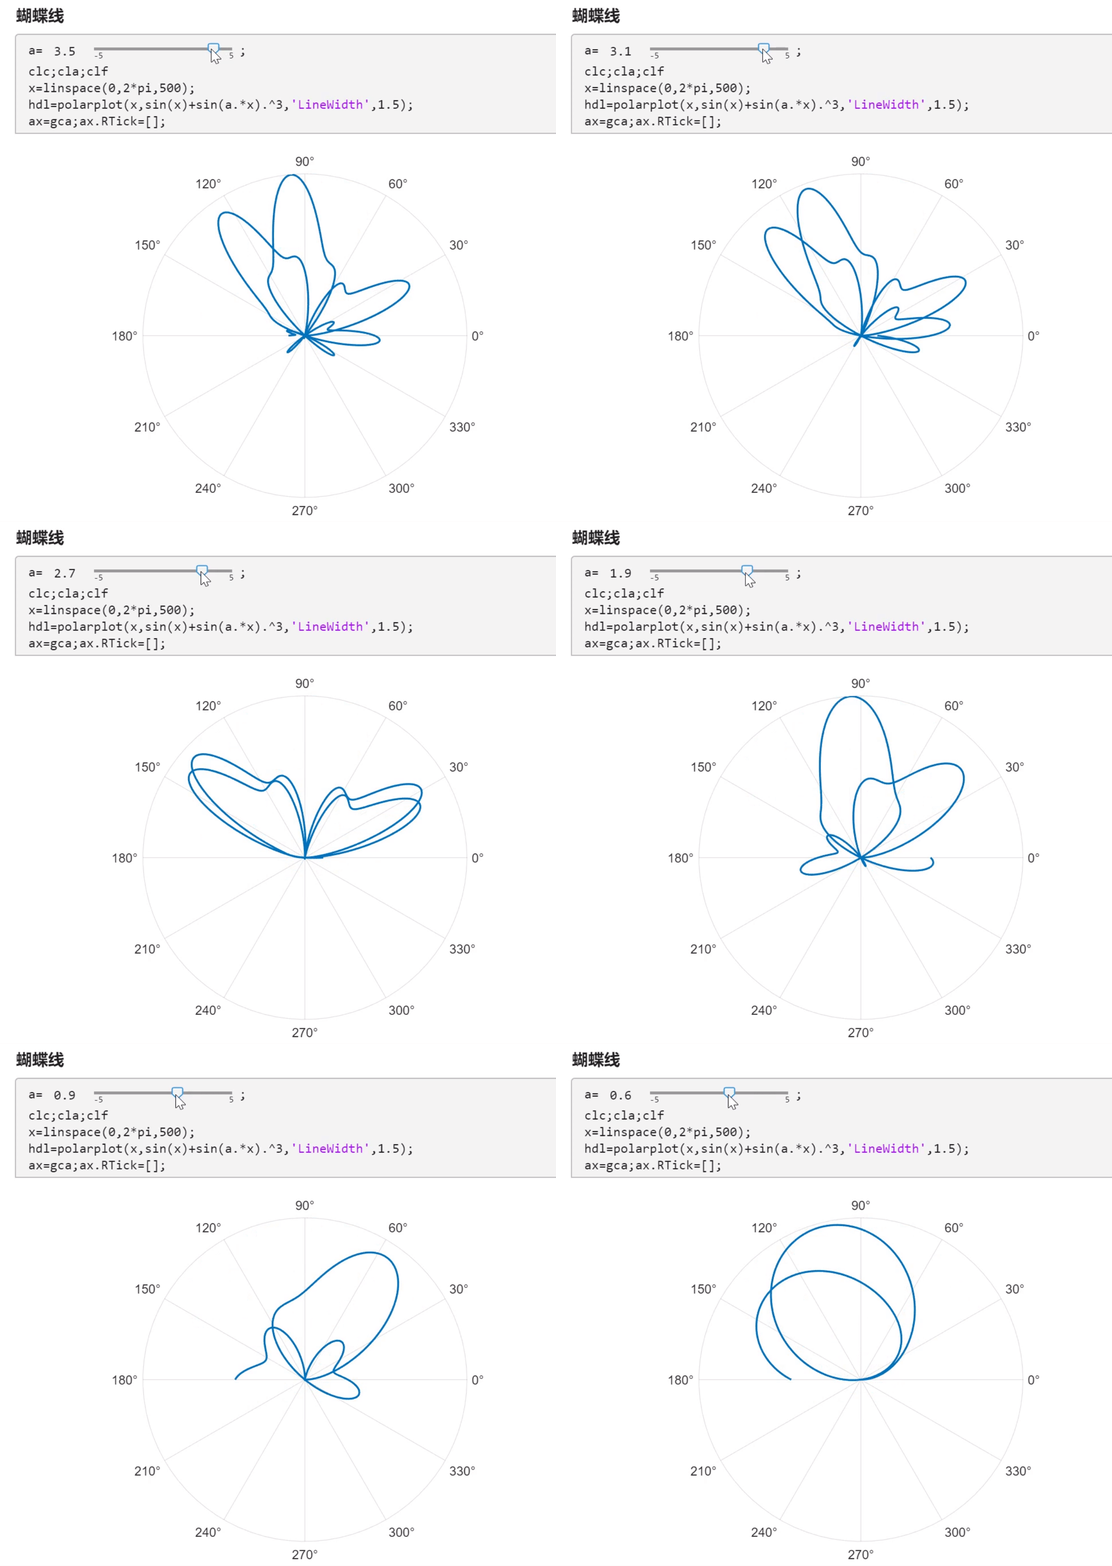
蝴蝶线
a=3.5; clc;cla;clf x=linspace(0,2*pi,500); hdl=polarplot(x,sin(x)+sin(a.*x).^3,'LineWidth',1.5); ax=gca;ax.RTick=[]; 变色玫瑰花
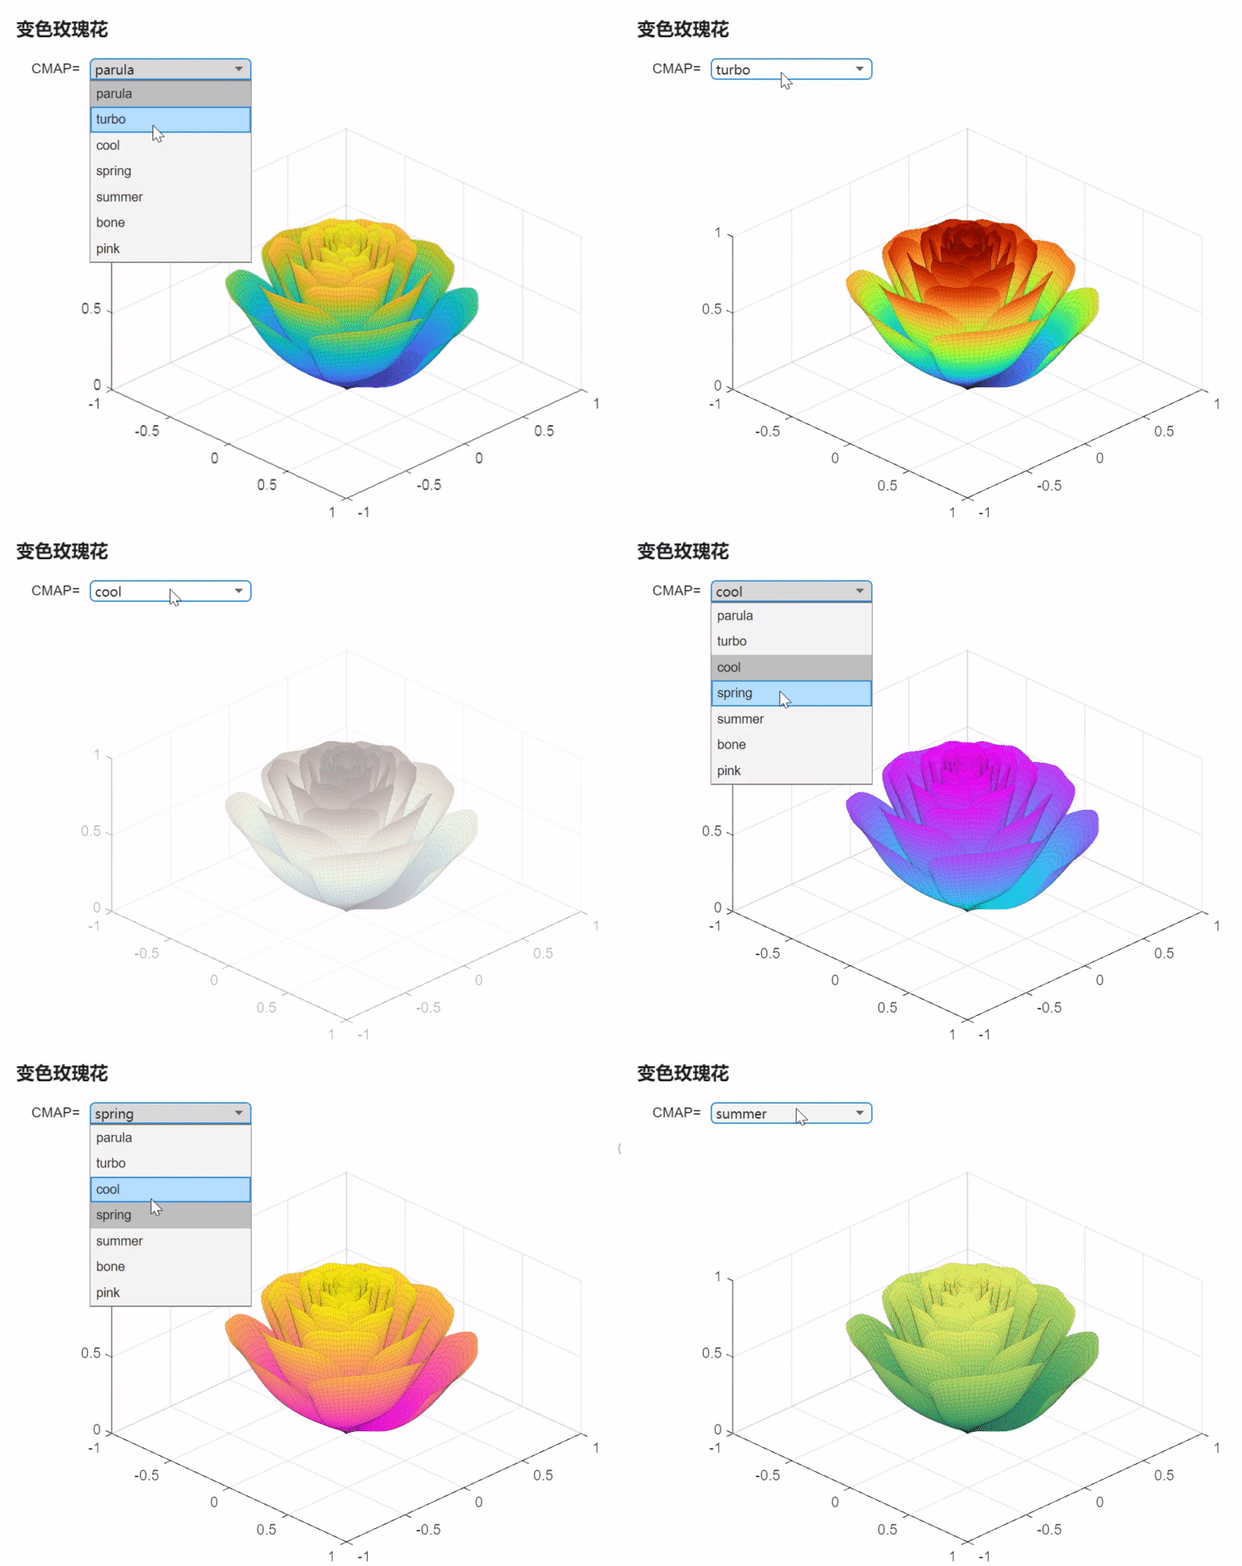
clc;cla;clf CMAP="parula"; [x,t]=meshgrid((0:24)./24,(0:0.5:575)./575.*20.*pi+4*pi); p=(pi/2)*exp(-t./(8*pi)); change=sin(15*t)/150; u=1-(1-mod(3.6*t,2*pi)./pi).^4./2+change; y=2*(x.^2-x).^2.*sin(p); r=u.*(x.*sin(p)+y.*cos(p)); h=u.*(x.*cos(p)-y.*sin(p)); surface(r.*cos(t),r.*sin(t),h,'EdgeAlpha',0.1,... 'EdgeColor',[0 0 0],'FaceColor','interp') colormap(CMAP) grid on view(45,45) 旋转多边形
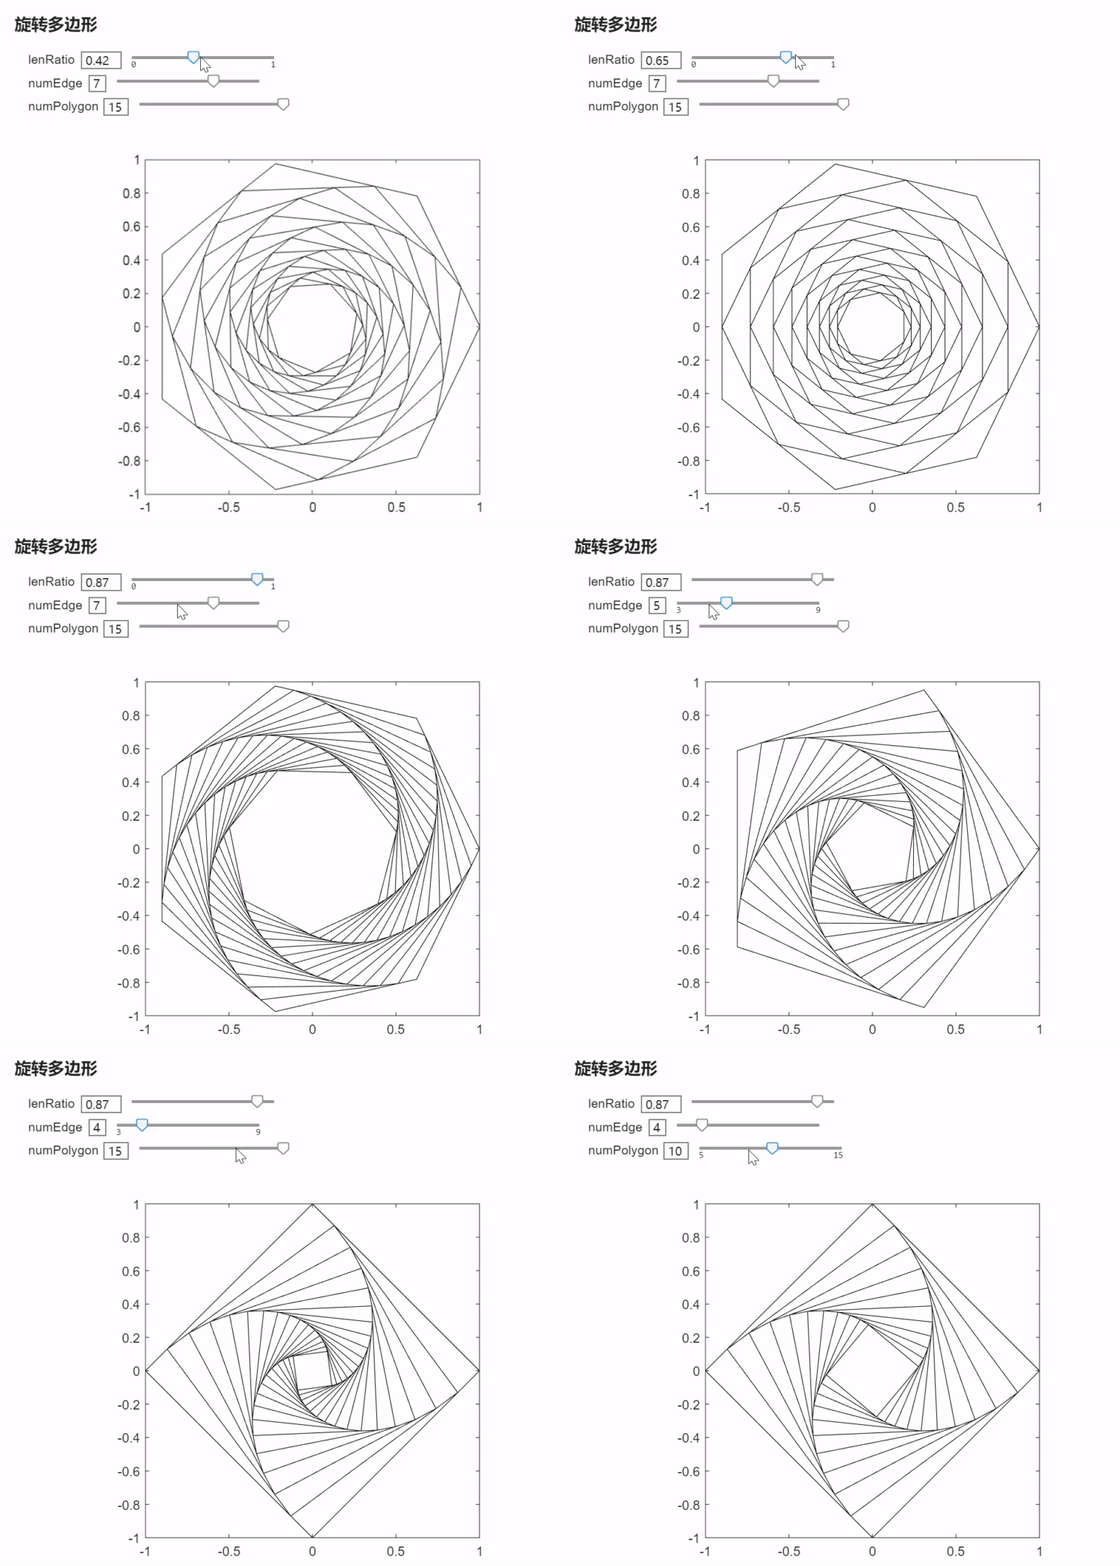
lenRatio=0.19; numEdge=7; numPolygon=14; clc;cla;clf theta=linspace(0,2*pi,numEdge+1); X=cos(theta);X(end)=[]; Y=sin(theta);Y(end)=[]; fill(X,Y,[0,0,0],'FaceColor','none'); hold on; axis equal axis([-1,1,-1,1]) for i=1:numPolygon tX=[X(2:end),X(1)]; tY=[Y(2:end),Y(1)]; X=(tX-X).*lenRatio+X; Y=(tY-Y).*lenRatio+Y; fill(X,Y,[0,0,0],'FaceColor','none'); end hold off R2019b
19b.1 自定义的图类
MATLAB很早之前就可以自定义类来绘图,不过这次开放功能后能够通过.运算更容易的修改属性和实时更新图形,官网给出一个例子:
classdef SmoothPlot < matlab.graphics.chartcontainer.ChartContainer properties XData (1,:) double = NaN YData (1,:) double = NaN SmoothColor (1,3) double {
   mustBeGreaterThanOrEqual(SmoothColor,0),... mustBeLessThanOrEqual(SmoothColor,1)} = [0.9290 0.6940 0.1250] SmoothWidth (1,1) double = 2 end properties(Access = private,Transient,NonCopyable) OriginalLine (1,1) matlab.graphics.chart.primitive.Line SmoothLine (1,1) matlab.graphics.chart.primitive.Line end methods(Access = protected) function setup(obj) % Get the axes ax = getAxes(obj); % Create the orginal and smooth lines obj.OriginalLine = plot(ax,obj.XData,obj.YData,'LineStyle',':'); hold(ax,'on') obj.SmoothLine = plot(ax,NaN,NaN,'LineStyle','-',... 'Color',obj.SmoothColor,'LineWidth',obj.SmoothWidth); hold(ax,'off') end function update(obj) % Update line data obj.OriginalLine.XData = obj.XData; obj.OriginalLine.YData = obj.YData; obj.SmoothLine.XData = obj.XData; obj.SmoothLine.YData = createSmoothData(obj); % Update line color and width obj.SmoothLine.Color = obj.SmoothColor; obj.SmoothLine.LineWidth = obj.SmoothWidth; end function sm = createSmoothData(obj) % Calculate smoothed data v = ones(1,10)*0.1; sm = conv(obj.YData,v,'same'); end end end
绘图:
x = 1:1:100; y = 10*sin(x./5) + 8*sin(10.*x + 0.5); c = SmoothPlot('XData',x,'YData',y); 快速属性设置示例一:
c.YData=c.YData./x; 快速属性设置示例二:
c.SmoothColor=[1,0,0]; 19b.2 更详细的子图布局
tiledlayout 和 nexttile 将会变为 subplot替代品,这个函数我也讲过了,在这篇推送中:https://mp.weixin..com/s/oN0Dckn1k4Y5lha2iYH2Ng
使用该函数可以轻松搞定截断坐标轴、共用colorbar、取消子图空隙等一系列subplot难以做到的事情,以下给出基本代码,详细信息查看上述推送:
取消子图空隙
tl=tiledlayout(2,2); tl.TileSpacing='none'; tl.Padding='none'; [X,Y,Z]=peaks; % 坐标区域块 1 nexttile surf(X,Y,Z) % 坐标区域块 2 nexttile contour(X,Y,Z,20) grid on % 坐标区域块 3 nexttile imagesc(Z) % 坐标区域块 4 nexttile plot3(X,Y,Z) grid on title(tl,'[surf] [contour] [imagesc] [plot3] chart of peaks') 共用colorbar
tl=tiledlayout(2,1); tl.TileSpacing='tight'; tl.Padding='tight'; Z1=peaks; Z2=membrane; % 坐标区域块 1 nexttile contourf(Z1,15) % 坐标区域块 2 nexttile contourf(Z2,10) cb=colorbar; cb.Layout.Tile='east'; 多个colorbar
% 随便生成点数据 x=1:15; n=70*randn(1,15)+50; y1=n+x.^2; y2=n-linspace(1,225,15); sz1=rand(1,15); sz2=rand(1,15); c=linspace(1,10,15); % 创建冬天风格色带的气泡图 t=tiledlayout(1,1); ax1=axes(t); bubblechart(ax1,x,y1,sz1,c) colormap(ax1,'winter') % 创建秋天风格色带的气泡图 ax2=axes(t); bubblechart(ax2,x,y2,sz2,c) colormap(ax2,'autumn') ax2.Visible='off'; % 隐藏第二个坐标区域好让俩气泡图显示在一起 % 让两个气泡图的坐标范围相同完美融合 linkaxes(t.Children) % 创建俩colorbar cb1=colorbar(ax1); cb1.Layout.Tile = 'east'; cb1.Label.String = 'Time (s)'; cb2=colorbar(ax2); cb2.Layout.Tile='east'; cb2.Label.String='Concentration (M)'; 截断坐标轴
% 绘制最底下的坐标区域 t=tiledlayout(1,2,'TileSpacing','compact'); bgAx=axes(t,'XTick',[],'YTick',[],'Box','off'); bgAx.Layout.TileSpan = [1 2]; % 生成数据 x=0:0.1:60; y=4.*cos(x)./(x+2); % 绘制[0,15]范围坐标区域 ax1=axes(t); plot(ax1,x,y,'LineWidth',2) xline(ax1,15,':'); ax1.Box='off'; xlim(ax1,[0 15]) xlabel(ax1,'First Interval') % 绘制[45 60]范围坐标区域 ax2=axes(t); ax2.Layout.Tile=2; plot(ax2,x,y,'LineWidth',2) xline(ax2,45,':'); ax2.YAxis.Visible='off'; ax2.Box='off'; xlim(ax2,[45 60]) xlabel(ax2,'Second Interval') % 同步y轴坐标范围 linkaxes([ax1 ax2], 'y') 19b.3 ColorOrder立刻生效
即使画完图后修改ColorOrder也会立刻生效:
x = linspace(-2*pi,2*pi); y1 = sin(x); y2 = cos(x); hold on plot(x,y1,'LineWidth',2) plot(x,y2,'LineWidth',2) set(gca,'ColorOrder',[0,0,0;.3,.3,.4]) 19b.4 堆叠条组负条形
堆叠条组在零的下方显示负的条形,而不是重叠它们:
y = [2 -2 3; 2 5 -6; -2 8 -9; -2 11 12]; bar(y,'stacked') R2020a
20a.1 箱线图归并
之前只有下载了Statistics and Machine Learning Toolbox工具箱才能使用箱线图boxplot,归并后无需额外下载工具箱即可使用箱线图boxchart:
X1=[1:2:7,13]; Y1=randn(100,5)+sin(X1); boxchart(Y1) tbl = readtable('TemperatureData.csv'); monthOrder = {
'January','February','March','April','May','June','July', ... 'August','September','October','November','December'}; tbl.Month = categorical(tbl.Month,monthOrder); boxchart(tbl.Month,tbl.TemperatureF,'GroupByColor',tbl.Year) ylabel('Temperature (F)') legend 20a.2 颜色线形均可批量设置
不仅仅ColorOrder可设置立刻生效,LineStyleOrder 也可立刻生效:
x = linspace(0,7); y = ones(length(x),9); for i = 1:9 y(:,i) = sin(x-i/5)'; end plot(x,y,'LineWidth',1.5) ax = gca; ax.ColorOrder = [1 0.5 0; 0.5 0 1; 0 0.5 0.3]; ax.LineStyleOrder = {
   '-','--',':'};
20a.3 图片保存
plot(rand(5,5),'LineWidth',3) ax = gca; exportgraphics(ax,'LinePlot.jpg') 关于使用按钮存储app图形官网给出了一个简单的示例:
function saveapp f = uifigure; ax = uiaxes(f,'Position',[25 25 400 375]); plot(ax,[0 0.3 0.1 0.6 0.4 1]) b = uibutton(f,'Position',[435 200 90 30],'Text','Save Plot'); b.ButtonPushedFcn = @buttoncallback; function buttoncallback(~,~) filter = {
   '*.jpg';'*.png';'*.tif';'*.pdf';'*.eps'}; [filename,filepath] = uiputfile(filter); if ischar(filename) exportgraphics(ax,[filepath filename]); end end end
R2020b
20b.1 更丰富气泡图
使用bubblechart3 在三维笛卡尔空间中创建气泡图。使用polarbubblechart函数在极坐标中创建气泡图:
x = rand(1,20); y = rand(1,20); z = rand(1,20); sz = rand(1,20); bubblechart3(x,y,z,sz); th = linspace(0,2*pi,10); r = rand(1,10); sz = rand(1,10); polarbubblechart(th,r,sz); 使用bubblelegend创建气泡图图例:
x = 1:10; y = exp(-0.5*x) + .05 * randn(1,10); sz = randi([20 500],[1,10]); bubblechart(x,y,sz) bubblelegend('Population') 20b.2 抖动散点图
使用swarmchart绘制抖动散点图:
x1 = ones(1,500); x2 = 2 * ones(1,500); x3 = 3 * ones(1,500); y1 = 2 * randn(1,500); y2 = [randn(1,250) randn(1,250) + 4]; y3 = 5 * randn(1,500) + 5; hold on swarmchart(x1,y1,15) swarmchart(x2,y2,15) swarmchart(x3,y3,15) 20b.3 半透明散点图
边缘和面均开始具有Alpha属性:
PntSet1=mvnrnd([2 3],[1 0;0 2],500); PntSet2=mvnrnd([6 7],[1 0;0 2],500); hold on scatter(PntSet1(:,1),PntSet1(:,2),80,'filled','MarkerFaceAlpha',.6) scatter(PntSet2(:,1),PntSet2(:,2),80,'filled','MarkerFaceAlpha',.6) 20b.4 副标题
使用subtitle函数添加副标题:
plot([0 2],[1 5]) title('Straight Line','FontSize',17) subtitle('Slope = 2, y-Intercept = 1') 20b.5 标题及轴标签左右对齐
- TitleHorizontalAlignment
- LabelHorizontalAlignment
设置标题和标签对齐模式,可设置为:
- left
- right
- center
plot([0 3 1 6]) title('Experimental Results') xlabel('Input Values') ylabel('Measured Values') ax = gca; ax.TitleHorizontalAlignment = 'left'; ax.XAxis.LabelHorizontalAlignment = 'left'; ax.YAxis.LabelHorizontalAlignment = 'left'; 20b.6 turbo 颜色图
内置添加 turbo 颜色图作为更自然的 jet 颜色图的代替:
20b.7 颜色归一化函数
validatecolor 函数可以将以下颜色格式转换为matlab支持的0-1RGB格式:
- 颜色名称,如 或 ‘red’‘green’
- 十六进制颜色代码,如 或 ‘#FF0000’‘#F00’
- 整数 RGB 三元组,如 uint8([255 0 0])
RGB = validatecolor({
   'red','green','blue'},'multiple')
RGB =
1 0 0
0 1 0
0 0 1
RGB = validatecolor({
   '#8000FF','#0F0','#FF9900'},'multiple')
RGB =
0.5020 0.0000 1.0000
0.0000 1.0000 0.0000
1.0000 0.6000 0.0000
20b.8 新标记
参考以下网址:
- https://ww2.mathworks.cn/matlabcentral/discussions/highlights/-new-in-r2020b-two-new-marker-symbols
2020b版本发布新marker
可以通过如下方式使用:
t=0:0.05:3*pi; hold on plot(t,cos(t),'_') plot(t,t./8,'|') 更多使用示例下载:
- https://ww2.mathworks.cn/matlabcentral/discussions/uploaded_files/1816/newMarkers.mlx
R2021a
21a.1 气泡词云
使用bubblecloud绘制旗气泡词云(啥时候不规则背景词云才能出。。。)
load patients b = bubblecloud(Weight(1:20),SelfAssessedHealthStatus(1:20)); 21a.2 常量线
常量线xline,yline可以同时绘制多条,并可设置多行标签:
x = linspace(0,6,100); y = exp(x); plot(x,y) xl=xline([4.5,exp(1)]); xl(1).Label={
   'Acceptable','Limit'}; xl(2).Label='exp(1)';
21a.3 标签自动旋转
刻度标签在拖拽图窗大小时会自动旋转,以在给定图窗大小和刻度标签数量的情况下提供最佳的显示效果。
21a.4 省缺图例
使用''可以通过省缺标签来省缺部分图例:
t=0:0.6:3*pi; plot(t,sin(t).*1.2,'LineWidth',2,'Marker','o') hold on plot(t,cos(t./2),'LineWidth',2,'Marker','s') plot(t,t,'LineWidth',2,'Marker','^') legend('',' y=cos(t/2)',' y=t'); R2021b
21b.1 刻度线方向分别设置
可以各个轴刻度线分别设置:
bar([2017 2018 2019 2020],1:4) ax = gca; ax.XAxis.TickDirection = 'none'; 甚至可以一个朝里一个朝外
bar([2017 2018 2019 2020],1:4) ax = gca; ax.XAxis.TickDirection = 'out'; 21b.2 新图片追加到pdf最后
plot([0 3 1 6 4 10]) exportgraphics(gca,'mycharts.pdf') bar([10 20 30 40]) exportgraphics(gca,'mycharts.pdf','Append',true) R2022a
22a.1 表绘图
通过将表直接传递到以下任何函数来创建图:plot、plot3、loglog、semilogx、semilogy 和 polarplot:
Temperature = (40:70)'; Humidity = (50:80)' + randn(31,1); T = table(Temperature,Humidity); plot(T,"Temperature","Humidity") 22a.2 新的gif创建方式
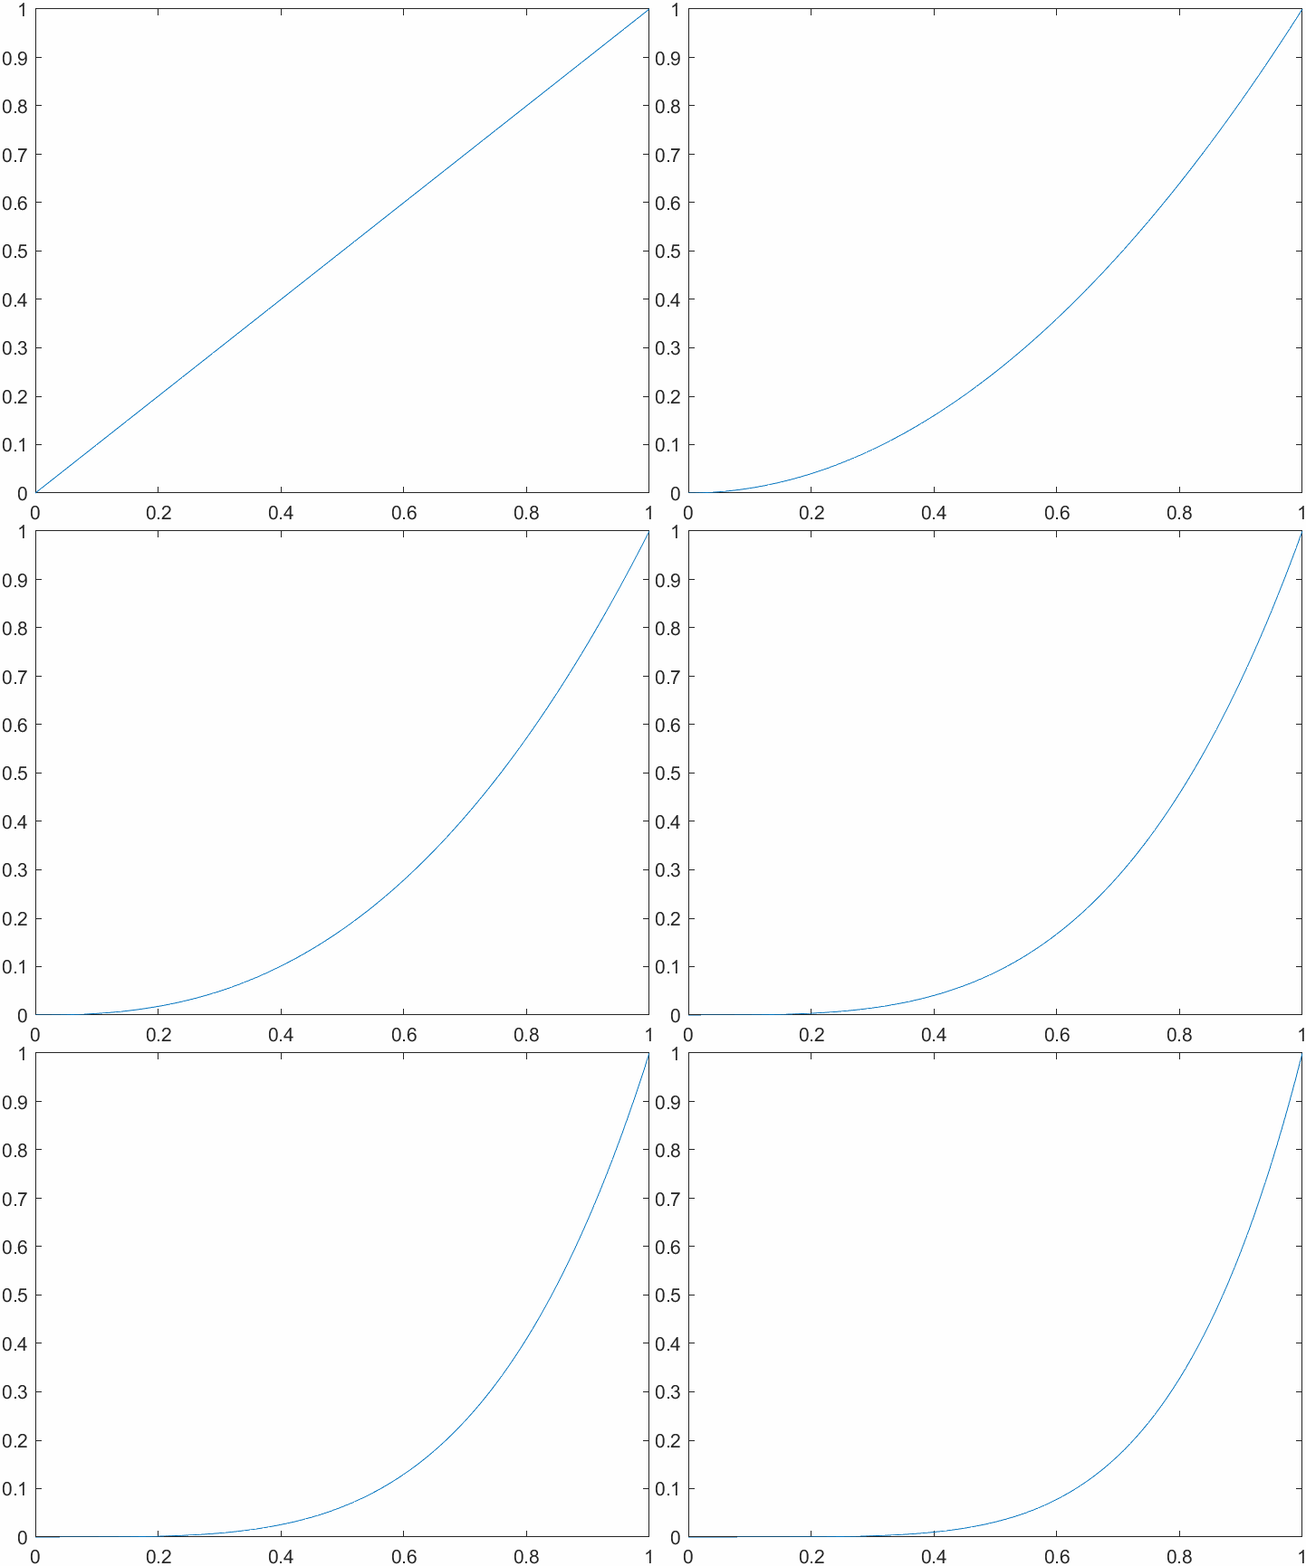
exportgraphics这个函数的导出功能属实强大,现在甚至支持导出为gif:
x = 0:0.01:1; p = plot(nan,nan); p.XData = x; for n = 1:0.5:5 p.YData = x.^n; exportgraphics(gcf,'testAnimated.gif','Append',true); end 22a.3 代码自动生成
当在实时编辑器中编辑图形时会自动生成更新图像的代码:
各种增删及修改还用很多,这里只是讲解一些比较常用的新特性,也算是一个呼吁大家使用新版本的文章,毕竟版本越新会有越来越多好用的函数。
参考:
- https://ww2.mathworks.cn/help/matlab/release-notes.html?s_tid=srchtitle_release%20note_1
免责声明:本站所有文章内容,图片,视频等均是来源于用户投稿和互联网及文摘转载整编而成,不代表本站观点,不承担相关法律责任。其著作权各归其原作者或其出版社所有。如发现本站有涉嫌抄袭侵权/违法违规的内容,侵犯到您的权益,请在线联系站长,一经查实,本站将立刻删除。 本文来自网络,若有侵权,请联系删除,如若转载,请注明出处:https://haidsoft.com/154689.html


