大家好,欢迎来到IT知识分享网。
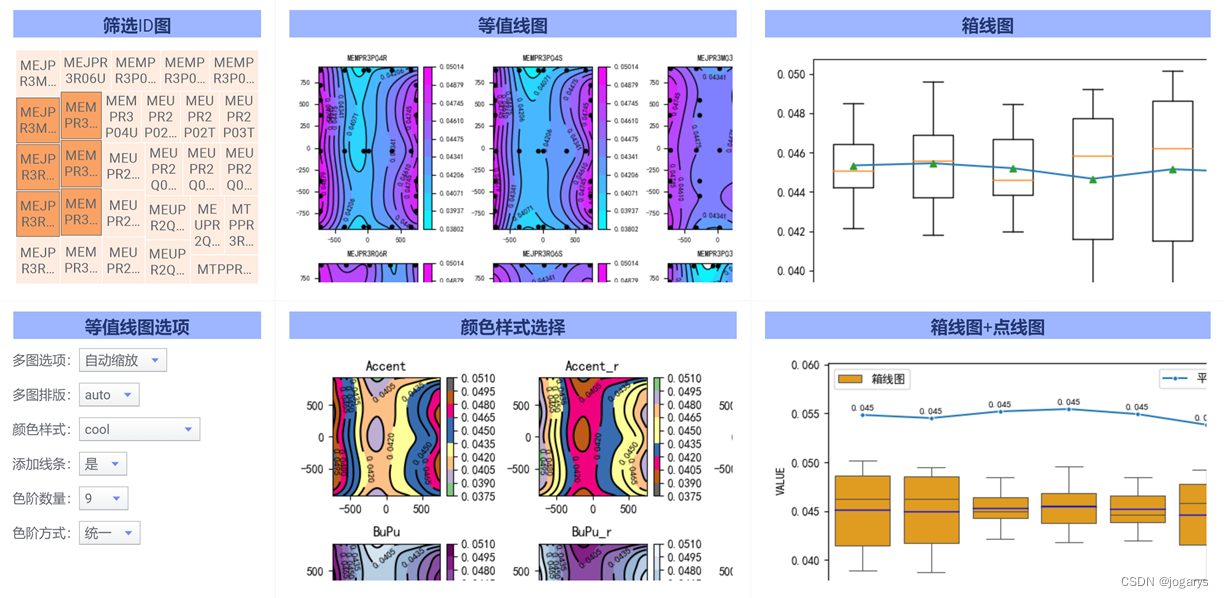
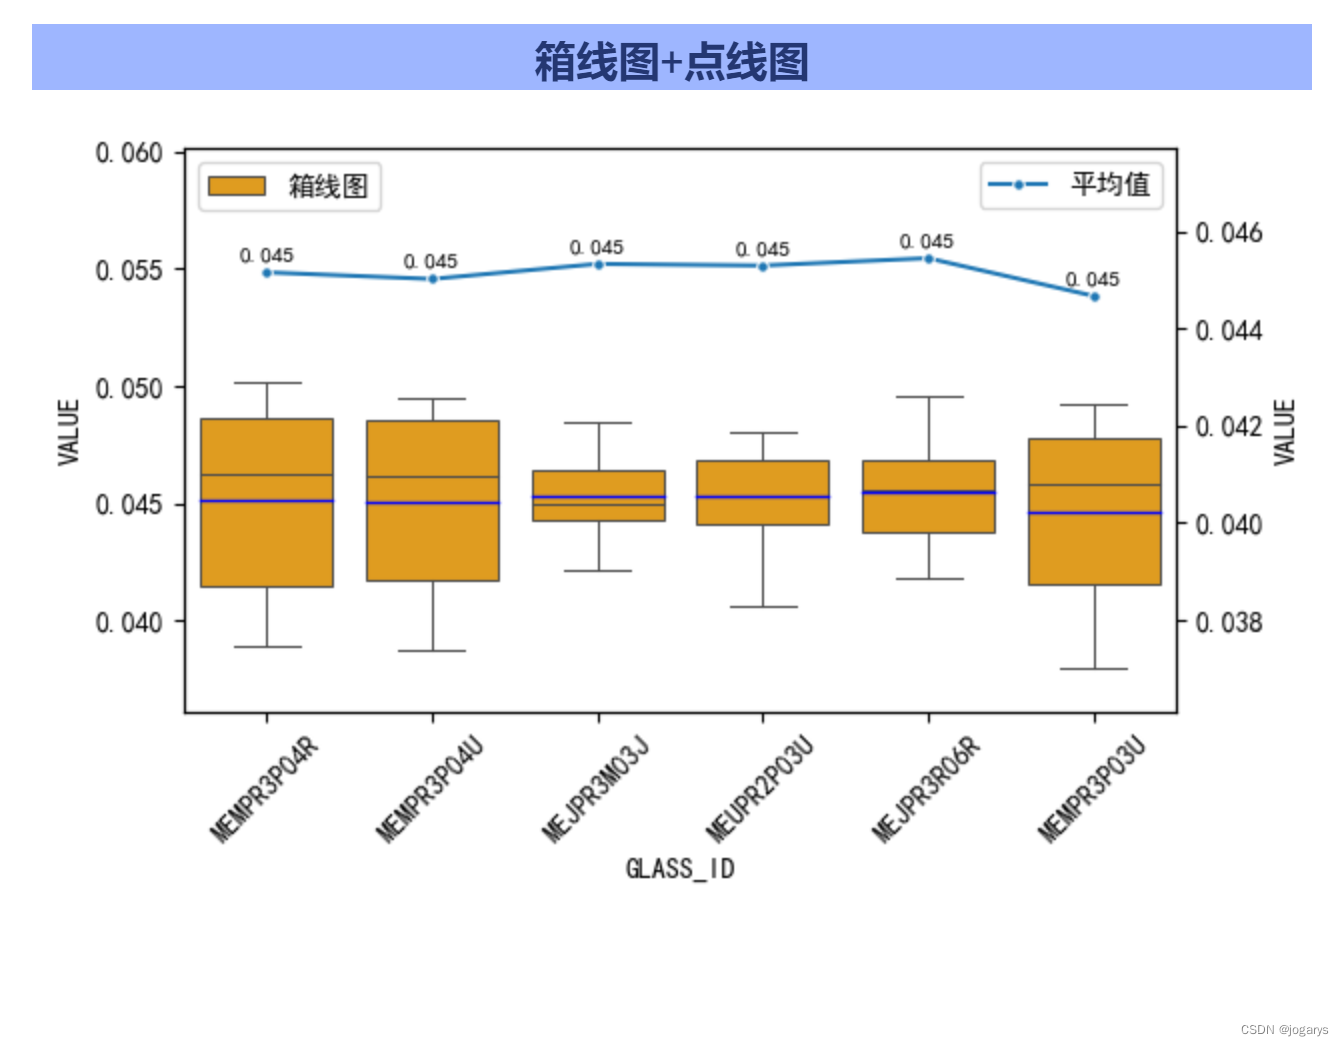
Spotfire提供了丰富的常用图表,如树形图、交叉表、条形图、饼图、散点图等,但还是有部分图表默认没有提供,如等值线图,或自定义组合图,如箱线图+点线图。不过Spotfire提供了自定义画图接口,可通过自定义函数(Python、R等)实现自定义画图,自定义画图的灵活大很大,可根据需求自由实现,等值线图和箱线图+点线图的效果如下:
实现方式:
1.数据准备
本案例所需的数据格式如下,即每个GLASS_ID所测试的不同点位坐标的测试值(附件可下载)
| GLASS_ID | COOR_GX | COOR_GY | VALUE | POINT_NO |
|---|---|---|---|---|
| MEMPR3P04R | -715.2 | -894.4 | 0.04678 | 1 |
| MEMPR3P04R | 364.3 | -894.4 | 0.04257 | 5 |
| MEMPR3P04R | 7.2 | -894.4 | 0.04069 | 4 |
| MEMPR3P04R | -69.8 | -894.4 | 0.0399 | 3 |
| MEMPR3P04R | -358.1 | -894.4 | 0.0419 | 2 |
| MEMPR3P04S | -715.2 | -894.4 | 0.04745 | 1 |
| MEMPR3P04S | 364.3 | -894.4 | 0.04201 | 5 |
| MEMPR3P04S | 7.2 | -894.4 | 0.04035 | 4 |
| MEMPR3P04S | -69.8 | -894.4 | 0.03993 | 3 |
| MEMPR3P04S | -358.1 | -894.4 | 0.04013 | 2 |
| MEMPR3P04T | -358.1 | -894.4 | 0.04167 | 2 |
| MEMPR3P04T | -69.8 | -894.4 | 0.03988 | 3 |
| MEMPR3P04T | 7.2 | -894.4 | 0.04055 | 4 |
| MEMPR3P04T | 364.3 | -894.4 | 0.04273 | 5 |
| MEMPR3P04T | -715.2 | -894.4 | 0.04667 | 1 |
| MEMPR3P04U | -715.2 | -894.4 | 0.04745 | 1 |
| MEMPR3P04U | -358.1 | -894.4 | 0.04004 | 2 |
2.等值线图
2.1等值线图选项准备:可根据需求增加或减少,通过文档属性传递至函数脚本中
多图选项:属性名:contourSizetype,值:自动缩放(zoom)/始终大图(large),指多个子图(多个GLASS_ID)时,固定每个小图尺寸(清晰度优先)还是固定大图尺寸(总尺寸优先)
多图排版:属性名:contourColNum,值:auto(0)/1列(1)/2列(2)……,指多图时的排版,auto值自动根据子图个数选择合适的排版,其它值为固定列数
颜色样式:属性名:contourColor,值如下,可将值存为表后选择来自列中的唯一值:,指等值线图的cmap参数(颜色样式)
| Accent,Accent_r,Blues,Blues_r,BrBG,BrBG_r,BuGn,BuGn_r,BuPu,BuPu_r,CMRmap,CMRmap_r,Dark2,Dark2_r,GnBu,GnBu_r,Greens,Greens_r,Greys,Greys_r,OrRd,OrRd_r,Oranges,Oranges_r,PRGn,PRGn_r,Paired,Paired_r,Pastel1,Pastel1_r,Pastel2,Pastel2_r,PiYG,PiYG_r,PuBu,PuBuGn,PuBuGn_r,PuBu_r,PuOr,PuOr_r,PuRd,PuRd_r,Purples,Purples_r,RdBu,RdBu_r,RdGy,RdGy_r,RdPu,RdPu_r,RdYlBu,RdYlBu_r,RdYlGn,RdYlGn_r,Reds,Reds_r,Set1,Set1_r,Set2,Set2_r,Set3,Set3_r,Spectral,Spectral_r,Wistia,Wistia_r,YlGn,YlGnBu,YlGnBu_r,YlGn_r,YlOrBr,YlOrBr_r,YlOrRd,YlOrRd_r,afmhot,afmhot_r,autumn,autumn_r,binary,binary_r,bone,bone_r,brg,brg_r,bwr,bwr_r,cividis,cividis_r,cool,cool_r,coolwarm,coolwarm_r,copper,copper_r,cubehelix,cubehelix_r,flag,flag_r,gist_earth,gist_earth_r,gist_gray,gist_gray_r,gist_heat,gist_heat_r,gist_ncar,gist_ncar_r,gist_rainbow,gist_rainbow_r,gist_stern,gist_stern_r,gist_yarg,gist_yarg_r,gnuplot,gnuplot2,gnuplot2_r,gnuplot_r,gray,gray_r,hot,hot_r,hsv,hsv_r,inferno,inferno_r,jet,jet_r,magma,magma_r,nipy_spectral,nipy_spectral_r,ocean,ocean_r,pink,pink_r,plasma,plasma_r,prism,prism_r,rainbow,rainbow_r,seismic,seismic_r,spring,spring_r,summer,summer_r,tab10,tab10_r,tab20,tab20_r,tab20b,tab20b_r,tab20c,tab20c_r,terrain,terrain_r,viridis,viridis_r,winter,winter_r |
添加线条:属性名:contourLine,值:是(yes)/否(no),指等值线图中是否添加线条
色阶数量:属性名:levelNum,值:数值范围(3~20),指等值线图的色阶分段数量
色阶方式:属性名:levelType,值:单独(0)/统一(1),指多个子图时,每个子图单独色阶还是采用统一色阶,统一色阶更方便对比子图之间的差异
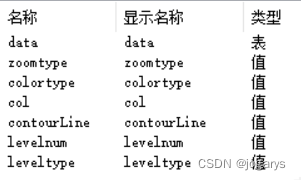
2.2自定义函数编写:新建自定义函数contourPlot,输入参数如下图,输出参数为二进制的值contourbinary
函数如下:
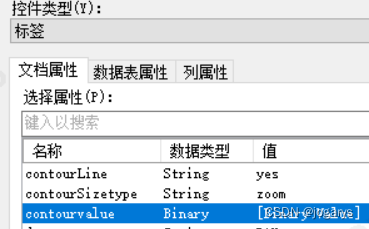
import pandas as pd import numpy as np import matplotlib.pyplot as plt from scipy.interpolate import Rbf plt.rcParams['font.sans-serif']=['SimHei'] # 用来正常显示中文标签 plt.rcParams['axes.unicode_minus']=False # 用来正常显示负号 if data.empty: plt.figure(figsize=(5,1)) plt.axis('off') plt.title('没有选择数据,输出空白图片',fontsize=18) plt.tight_layout() plt.savefig('contourplot.png') else: glasses = data['GLASS_ID'].unique() if leveltype == 0: level = levelnum+1 else: value_max = data['VALUE'].max() value_min = data['VALUE'].min() level = np.linspace(value_min,value_max,levelnum+1) num = len(glasses) if col == 0: col = int(np.ceil(np.sqrt(num))) row = int(np.ceil(num/col)) if zoomtype == 'large': plt.figure(figsize = (col*5,row*5)) font_size = 10 else: plt.figure() font_size = int(10/col(1/3)) plt.rc('font', size=font_size) for i in range(num): df = data[data['GLASS_ID']==glasses[i]] df1=df["COOR_GX"]#读取第一列数据 df2=df['COOR_GY']#读取第二列数据 df3=df['VALUE']#读取第三列数据 odf1=np.linspace(-750,750,50)#设置网格经度 odf2=np.linspace(-925,925,50)#设置网格纬度 odf1,odf2=np.meshgrid(odf1,odf2)#网格化 func=Rbf(df1,df2,df3,function='cubic')#定义插值函数 odf3_new=func(odf1,odf2)#获得插值后的z值 ax1 = plt.subplot(row,col,i+1) plt.title(glasses[i], fontsize=int(font_size*1.2)) if contourLine == 'yes': line = plt.contour(odf1,odf2,odf3_new,level,colors = 'black',linewidths=1.0) plt.clabel(line , inline=True) plt.contourf(odf1,odf2,odf3_new,level,cmap=colortype)#画图 plt.colorbar() plt.scatter(df1,df2,c='black',s=10) plt.tight_layout() plt.savefig('contourplot.png') with open('contourplot.png','rb') as file: contourbinary = file.read() 2.3图形展示:新建文本区域,选择标签类型,关联属性为输出的二进制值contourbinary
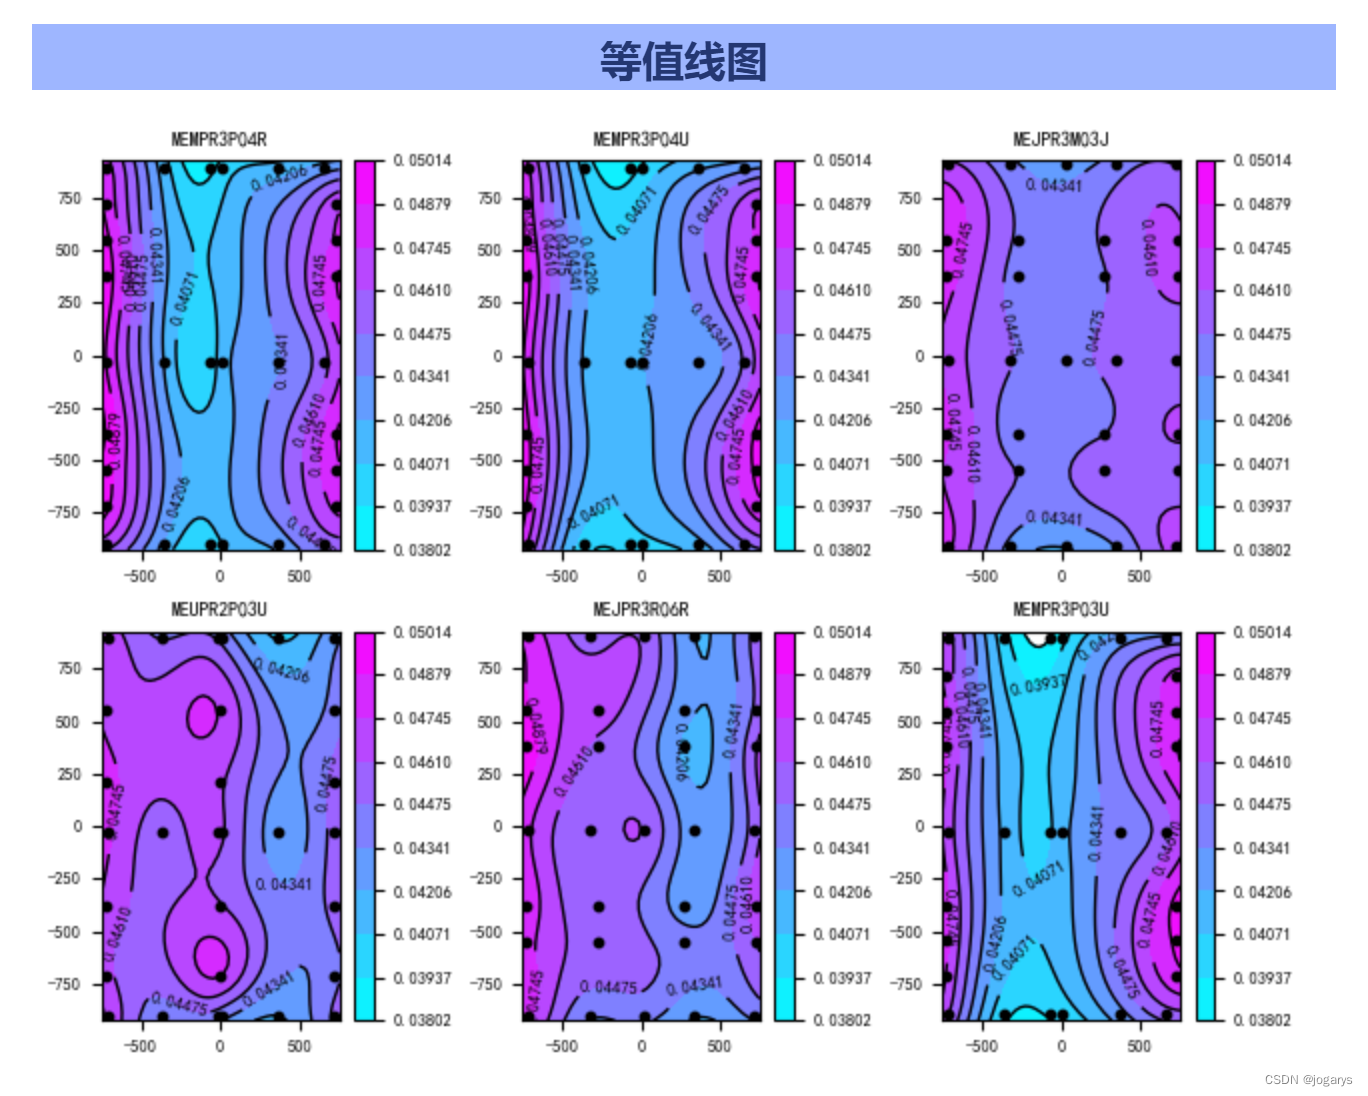
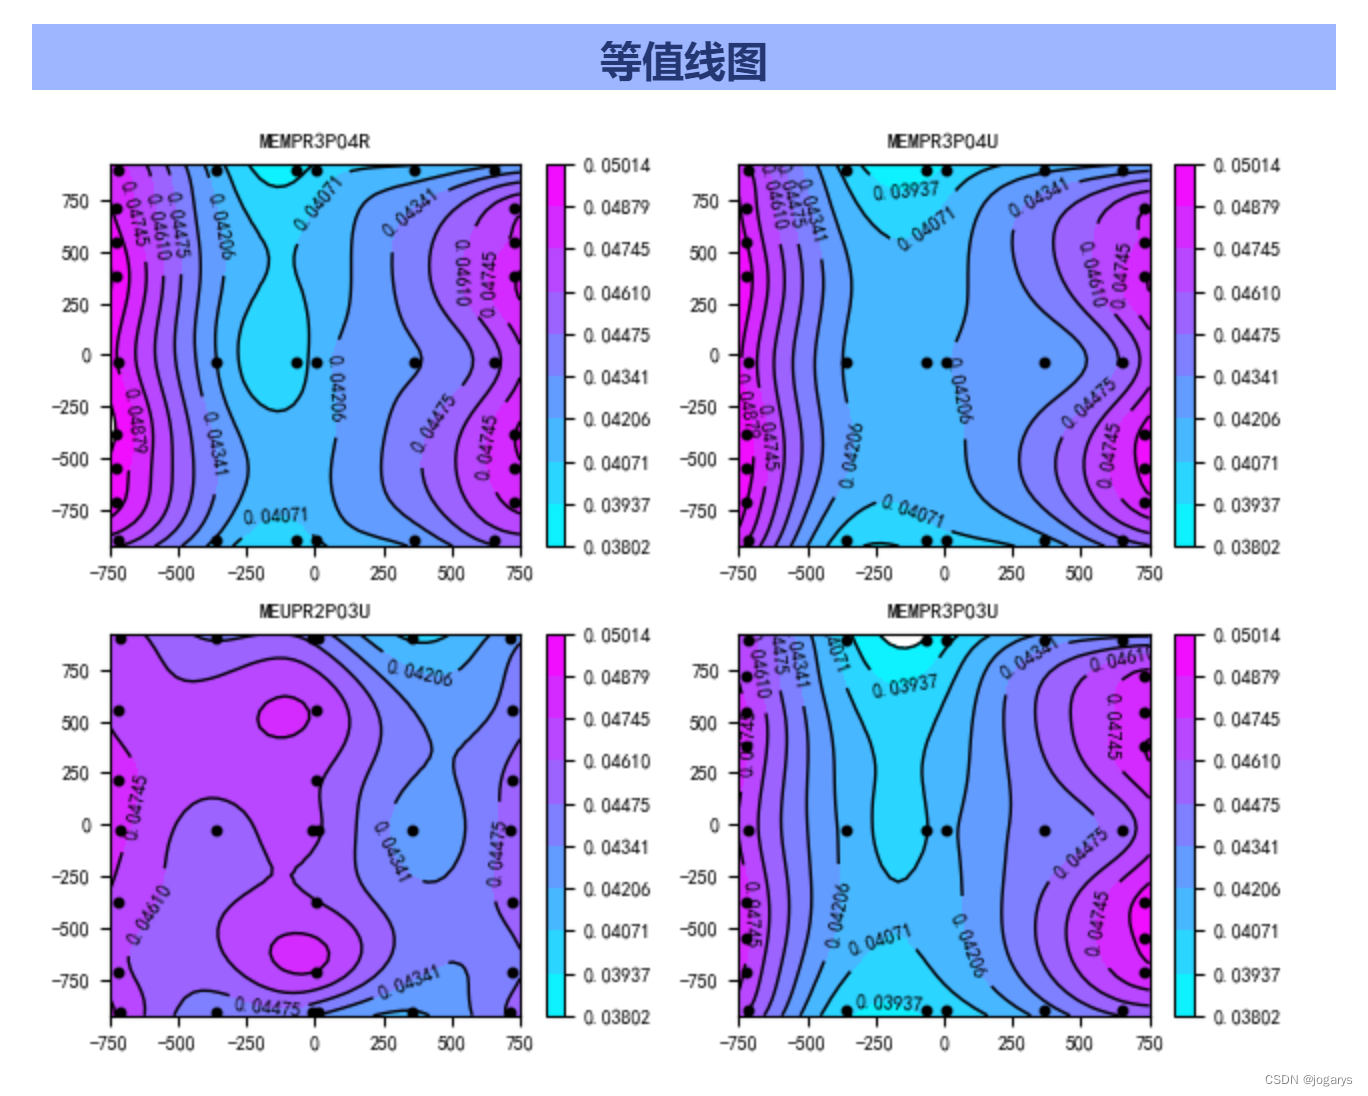
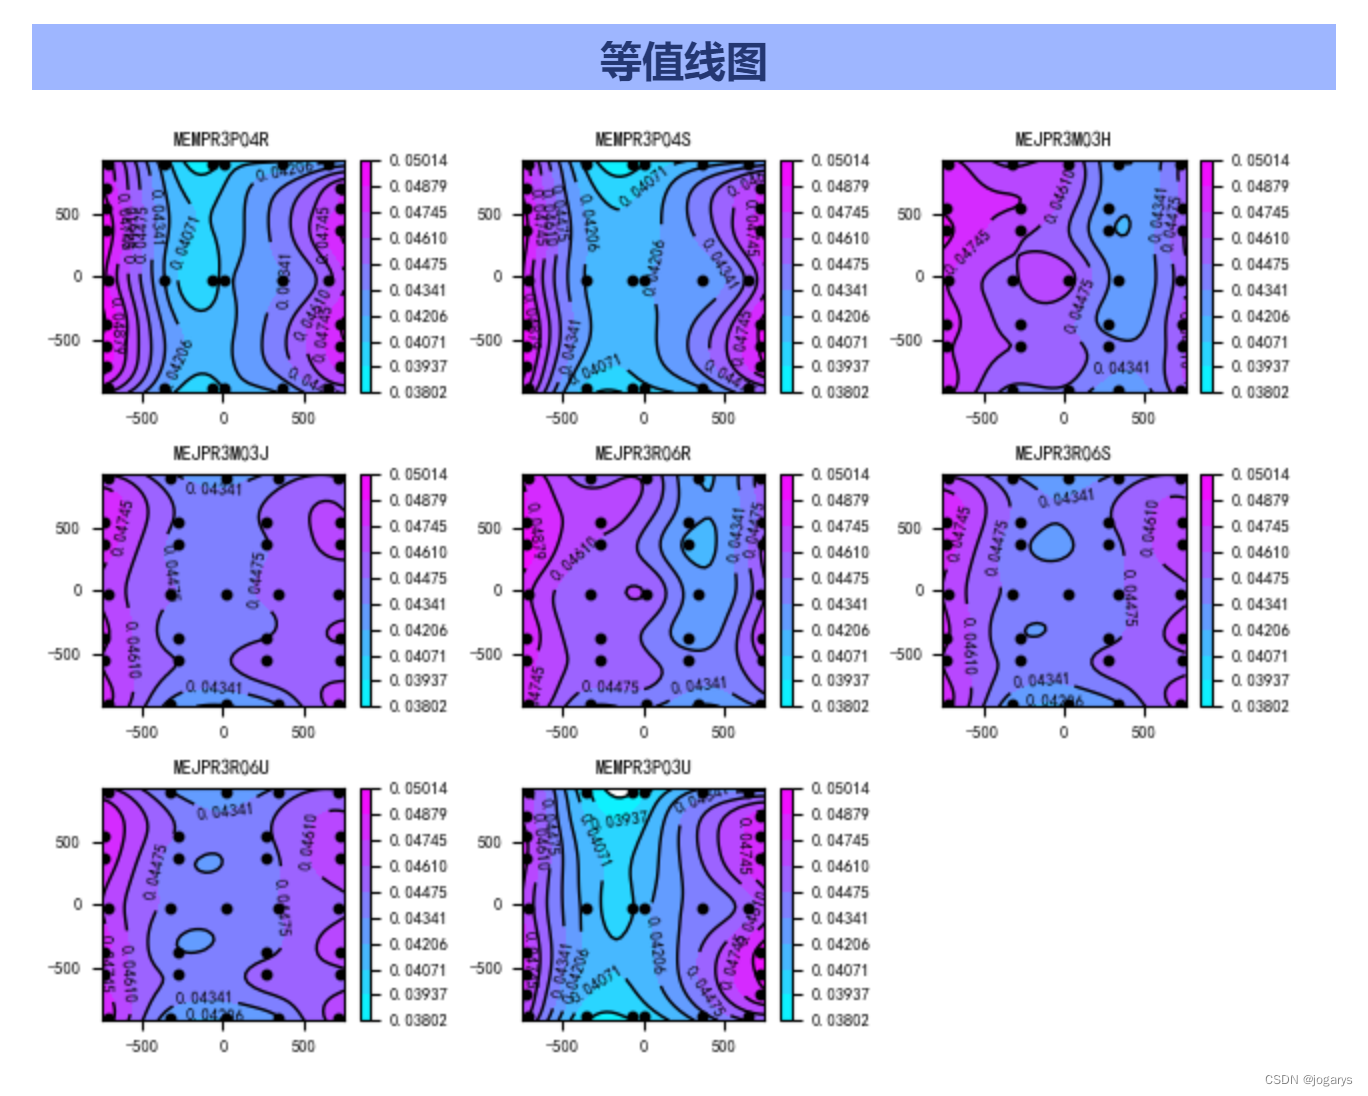
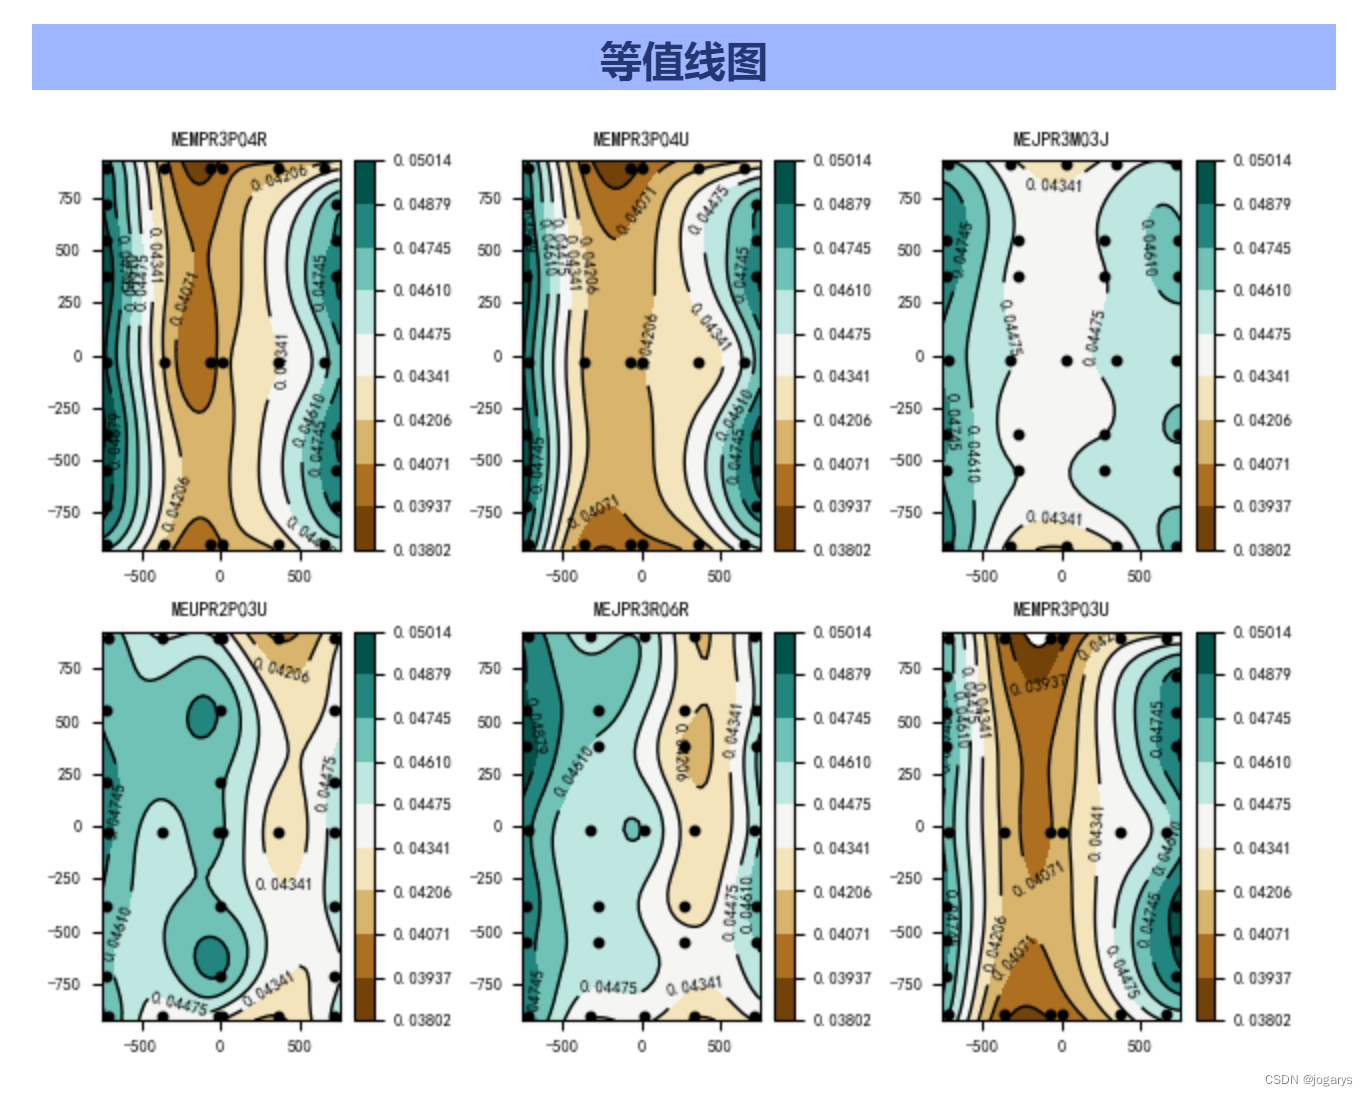
效果如下:
选择4个GLASS_ID自动排版为2×2:
选择8个GLASS_ID自动排版为3×3:
切换颜色样式为BrBG
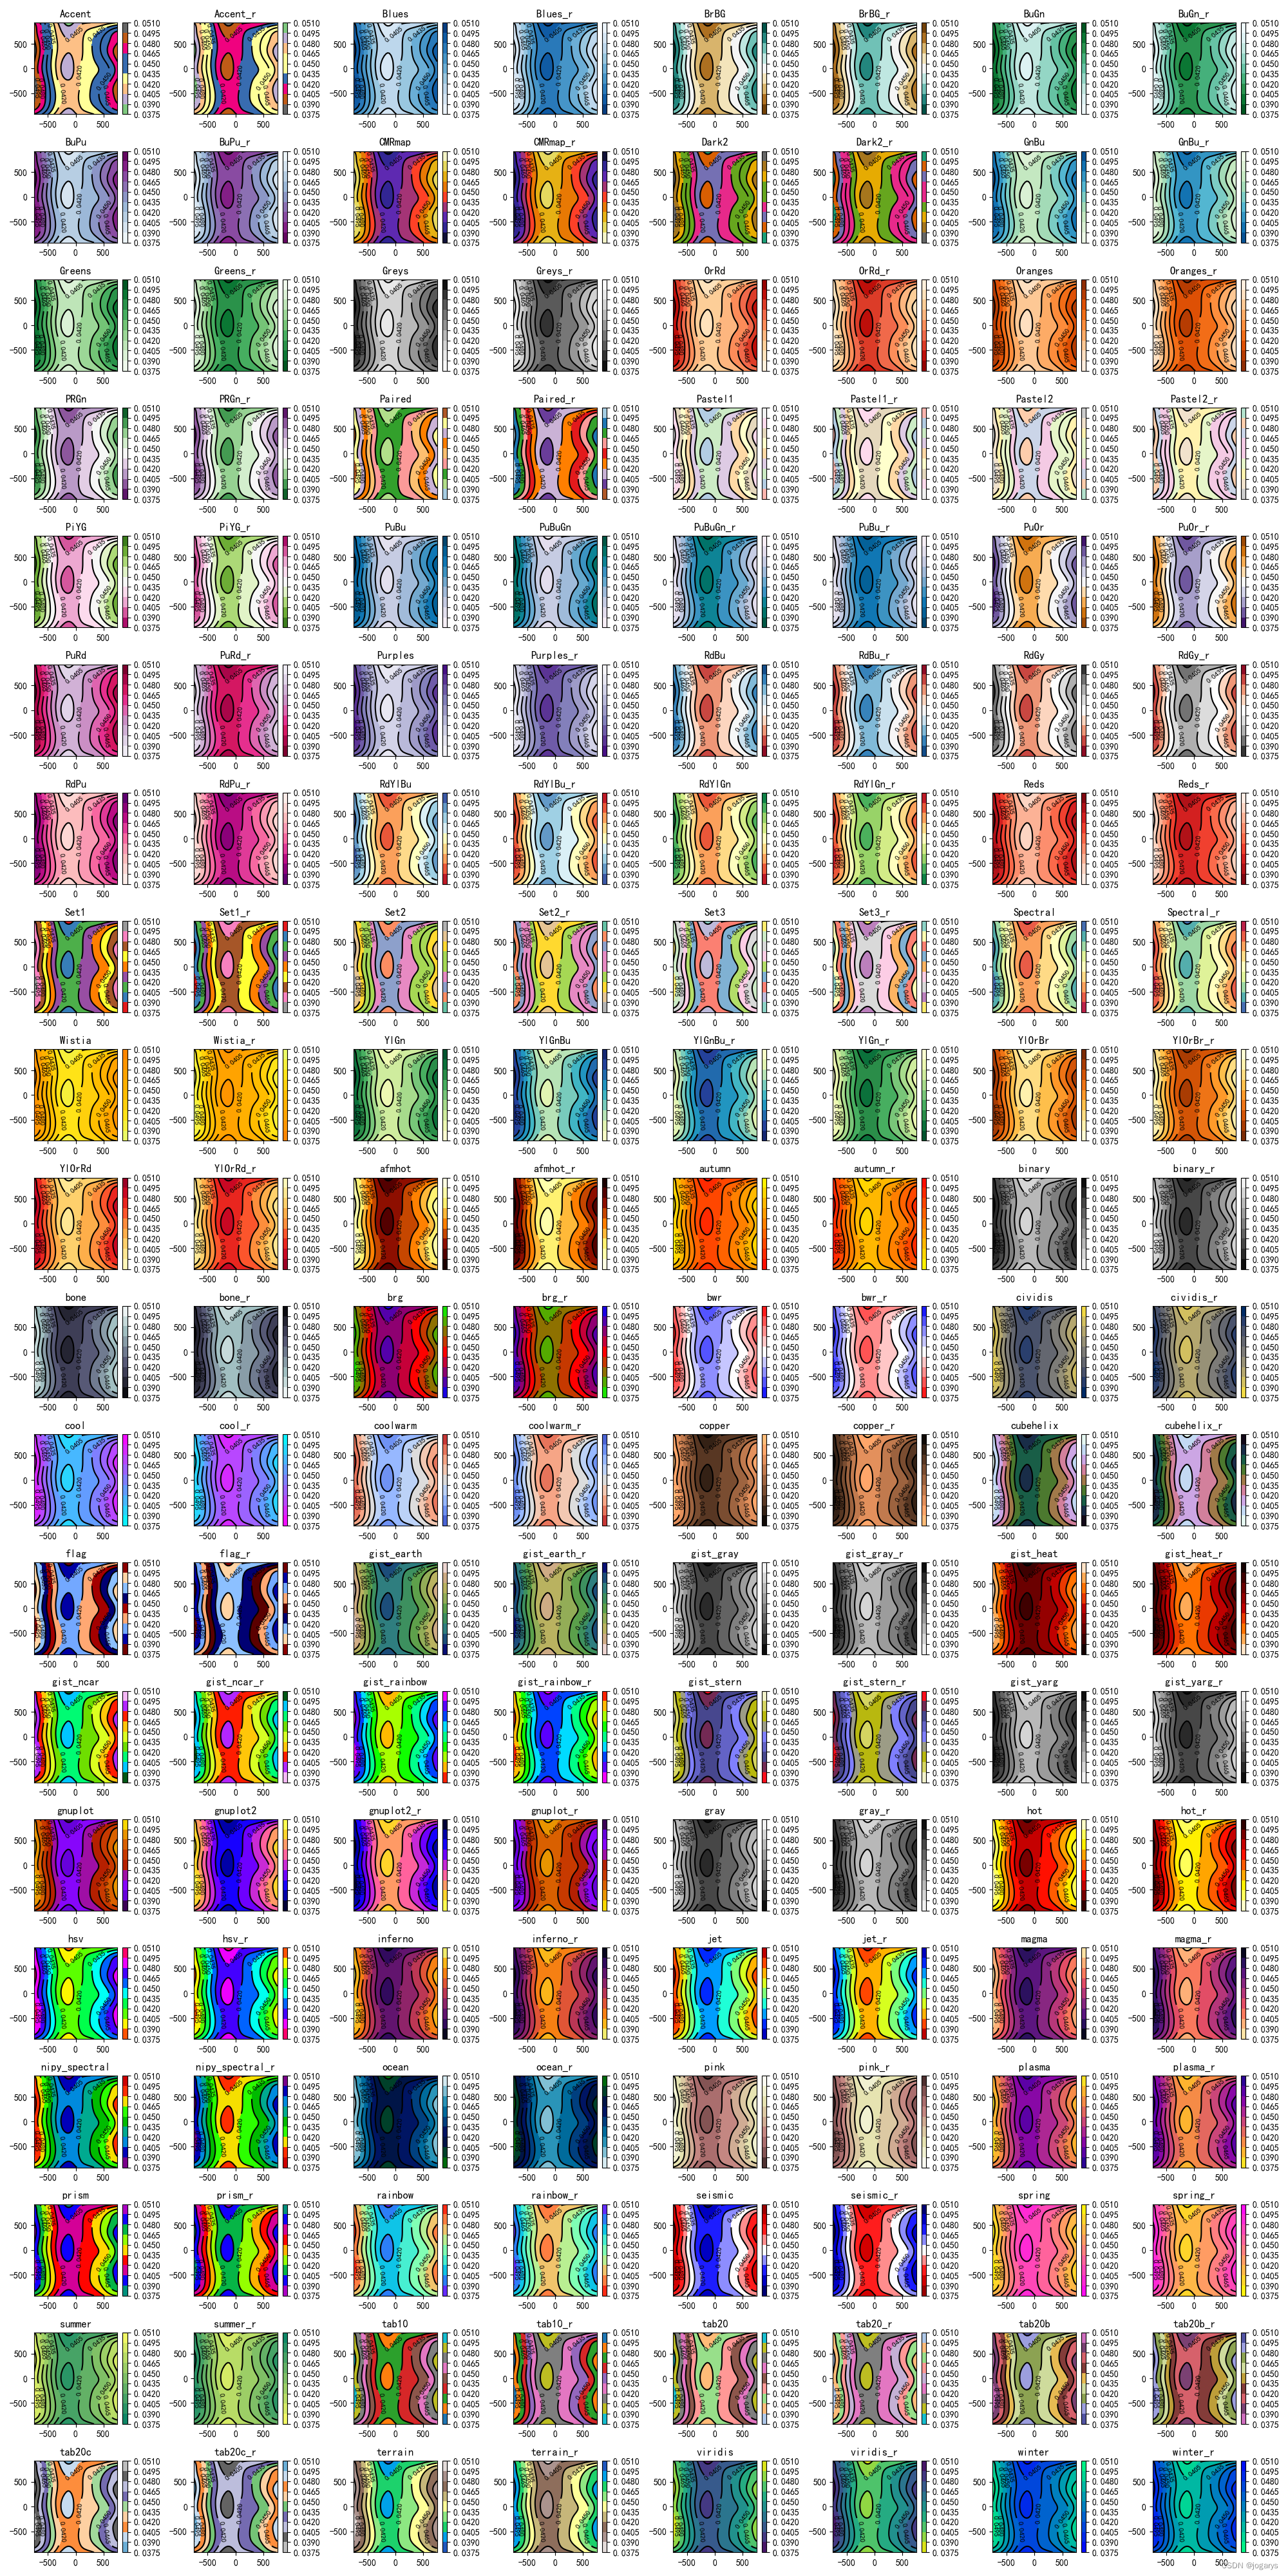
2.4生成所有色阶图:可以用脚本生成所有色阶图,方便直观选择色阶
CMAP = 'Accent, Accent_r, Blues, Blues_r, BrBG, BrBG_r, BuGn, BuGn_r, BuPu, BuPu_r, CMRmap, CMRmap_r, Dark2, Dark2_r, GnBu, GnBu_r, Greens, Greens_r, Greys, Greys_r, OrRd, OrRd_r, Oranges, Oranges_r, PRGn, PRGn_r, Paired, Paired_r, Pastel1, Pastel1_r, Pastel2, Pastel2_r, PiYG, PiYG_r, PuBu, PuBuGn, PuBuGn_r, PuBu_r, PuOr, PuOr_r, PuRd, PuRd_r, Purples, Purples_r, RdBu, RdBu_r, RdGy, RdGy_r, RdPu, RdPu_r, RdYlBu, RdYlBu_r, RdYlGn, RdYlGn_r, Reds, Reds_r, Set1, Set1_r, Set2, Set2_r, Set3, Set3_r, Spectral, Spectral_r, Wistia, Wistia_r, YlGn, YlGnBu, YlGnBu_r, YlGn_r, YlOrBr, YlOrBr_r, YlOrRd, YlOrRd_r, afmhot, afmhot_r, autumn, autumn_r, binary, binary_r, bone, bone_r, brg, brg_r, bwr, bwr_r, cividis, cividis_r, cool, cool_r, coolwarm, coolwarm_r, copper, copper_r, cubehelix, cubehelix_r, flag, flag_r, gist_earth, gist_earth_r, gist_gray, gist_gray_r, gist_heat, gist_heat_r, gist_ncar, gist_ncar_r, gist_rainbow, gist_rainbow_r, gist_stern, gist_stern_r, gist_yarg, gist_yarg_r, gnuplot, gnuplot2, gnuplot2_r, gnuplot_r, gray, gray_r, hot, hot_r, hsv, hsv_r, inferno, inferno_r, jet, jet_r, magma, magma_r, nipy_spectral, nipy_spectral_r, ocean, ocean_r, pink, pink_r, plasma, plasma_r, prism, prism_r, rainbow, rainbow_r, seismic, seismic_r, spring, spring_r, summer, summer_r, tab10, tab10_r, tab20, tab20_r, tab20b, tab20b_r, tab20c, tab20c_r, terrain, terrain_r, viridis, viridis_r, winter, winter_r'.split(', ') num = len(CMAP) col = 8#int(np.ceil(np.sqrt(num))) row = int(np.ceil(num/col)) plt.figure(figsize = (col*2.5,row*2)) # plt.rcParams['font.sans-serif'] = ['Microsoft YaHei'] plt.rcParams['font.sans-serif']=['SimHei'] # 用来正常显示中文标签 plt.rcParams['axes.unicode_minus']=False # 用来正常显示负号 for i in range(num): df = data[data['GLASS_ID']==glasses[0]] df1=df["COOR_GX"]#读取第一列数据 df2=df['COOR_GY']#读取第二列数据 df3=df['VALUE']#读取第三列数据 odf1=np.linspace(-750,750,50)#设置网格经度 odf2=np.linspace(-925,925,50)#设置网格纬度 odf1,odf2=np.meshgrid(odf1,odf2)#网格化 func=Rbf(df1,df2,df3,function='cubic')#定义插值函数 odf3_new=func(odf1,odf2)#获得插值后的z值 ax1 = plt.subplot(row,col,i+1) plt.title(CMAP[i], fontsize=12) line = plt.contour(odf1,odf2,odf3_new,10,colors = 'black') plt.clabel(line , inline=True, fontsize=8) plt.contourf(odf1,odf2,odf3_new,10,cmap=CMAP[i])#画图 plt.colorbar() plt.tight_layout() plt.savefig('CMAP.png')3.箱线图+点线图
实现方式相同,只是函数代码不同
import pandas as pd import numpy as np import matplotlib.pyplot as plt import seaborn as sns #计算坐标轴范围,使line和box分开展示 value_max, value_min ,value_max_right= data['VALUE'].max(),data['VALUE'].min(),data.groupby('GLASS_ID')['VALUE'].mean().max() value_max_left = max(value_max*0.8,value_max*1.2) value_max_right = max(value_max_right*0.95,value_max_right*1.05) value_min = min(value_min*0.95,value_min*1.05) #计算横坐标,用于横坐标隐藏设置,标签显示等 x_label = data['GLASS_ID'].unique() plt.figure(figsize = (6.5,4)) plt.rcParams['font.sans-serif']=['SimHei'] # 用来正常显示中文标签 plt.rcParams['axes.unicode_minus']=False # 用来正常显示负号 plt.xticks(rotation=45) #90度旋转 # ax1 = plt.subplot(111) ax1 = sns.boxplot(x='GLASS_ID',y='VALUE',data=data, color='orange', #箱子颜色 showcaps=True,#上下横线显示,可省略 showfliers=True,#异常值显示,可省略 # fliersize=5,#异常值大小 flierprops={'marker':'*','markeredgecolor':'red','markersize':'5'}, linewidth=0.75,#箱子线宽 # medianprops = {'linestyle':'-','color':'orange'},#设置中位数线线型及颜色 showmeans=True, meanline=True,#显示均值线 meanprops = {'linestyle':'-','color':'blue'},#设置均值线属性 # meanprops={"marker": "o", # "markeredgecolor": "black", # "markerfacecolor": "red", # "markersize": "6"} ) ax1.set_ylim([value_min,value_max_left]) ax1.legend(labels=['箱线图'], loc='upper left') ax2 = ax1.twinx()#跟ax1共用一个x轴,组合图使用 ax2 = sns.lineplot(x='GLASS_ID',y='VALUE',data=data,label='平均值', marker='o',markersize=4, estimator='mean', ci=None # 取消阴影 ) ax2.set_ylim([value_min,value_max_right]) ax2.legend(loc='best') for i in range(len(x_label)):#(0,len(x_label),1): ax2.text(x_label[i],data.groupby('GLASS_ID')['VALUE'].mean()[x_label[i]]+(value_max_right-value_min)/50, format(data.groupby('GLASS_ID')['VALUE'].mean()[x_label[i]],'.2g'), fontsize=8, horizontalalignment='center',#水平对齐方式 ,可以填 ‘center’ , ‘right’ ,‘left’ 等 # verticalalignment='baseline',#垂直对齐方式 ,可选 ‘center’ ,‘top’ , ‘bottom’,‘baseline’ 等 #rotation=90, color='black'#字体颜色,可省略 ) plt.xticks(range(0,len(x_label),1)) #坐标间隔设置 # fig.autofmt_xdate() plt.tight_layout() plt.savefig('boxplot.png') #with open('boxplot.png','rb') as file: # boxbinary = file.read() boxbinary = open('boxplot.png','rb').read()
免责声明:本站所有文章内容,图片,视频等均是来源于用户投稿和互联网及文摘转载整编而成,不代表本站观点,不承担相关法律责任。其著作权各归其原作者或其出版社所有。如发现本站有涉嫌抄袭侵权/违法违规的内容,侵犯到您的权益,请在线联系站长,一经查实,本站将立刻删除。 本文来自网络,若有侵权,请联系删除,如若转载,请注明出处:https://haidsoft.com/127648.html

